
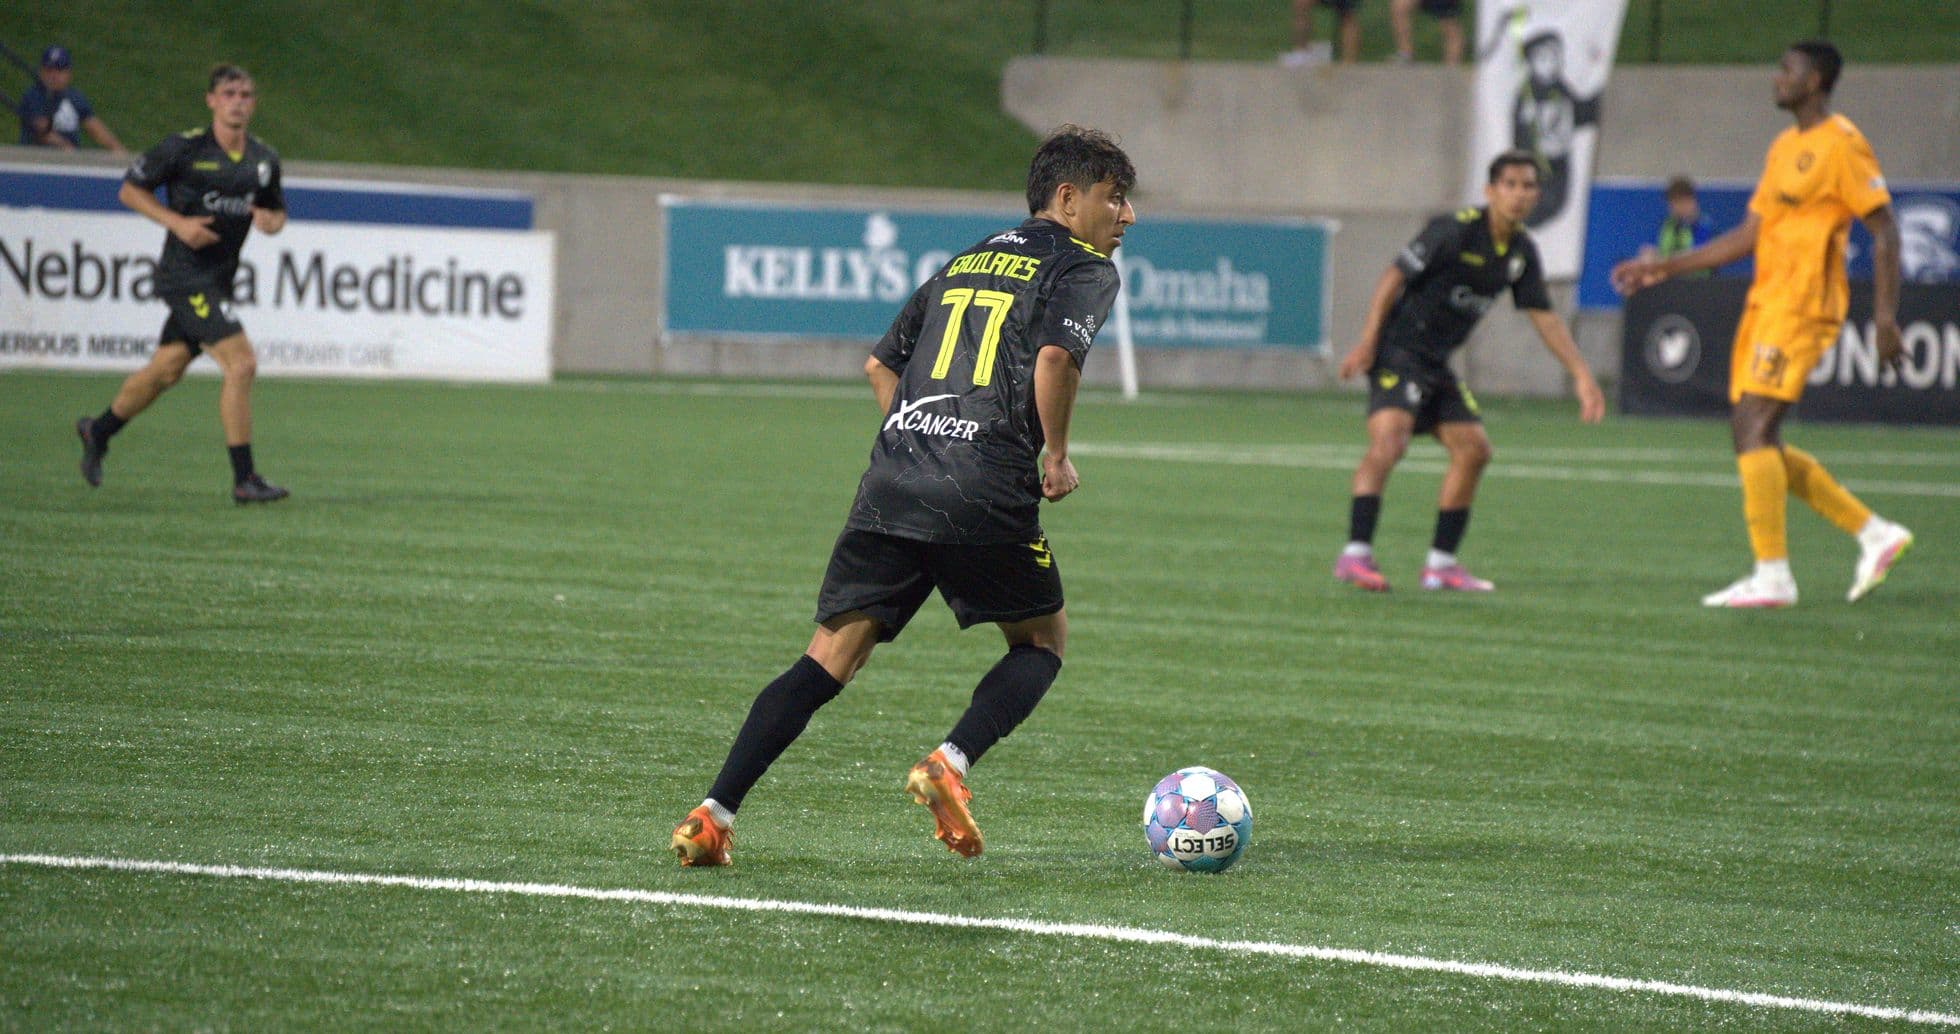
Union Omaha Dominates Fort Wayne 4–2 in USL Cup Showdown
Under the lights at Werner Park, Union Omaha’s 4–2 victory over Fort Wayne felt less like a routine group-stage outing and more like a statement about contrasting identities in the USL League One Cup. This was a meeting between a side leaning into controlled chaos and another still searching for the defensive spine to match its attacking promise.
Heading into this game, the table already hinted at the storylines. Union Omaha sat 2nd in USL Cup 2026, Group 4 with 6 points from 3 matches, built on 2 wins and 1 defeat. Their overall goal difference was -1, the product of 7 goals for and 8 against, a reminder that their attacking verve comes at a cost. At Werner Park, that duality was even sharper: at home they had scored 5 and conceded 7 across 2 matches, an average of 2.5 goals for and 3.5 against. They were winning shootouts, not strangling games.
Fort Wayne, by contrast, arrived as a team on the brink. They were 6th in the group with just 1 point and a goal difference of -6, having scored 6 and conceded 12 overall. On their travels, the numbers were grim: 0 points from 2 away fixtures, with 3 goals scored and 7 conceded, an away average of 1.5 goals for and 3.5 against. The pattern was clear: they could hurt teams going forward, but their defensive structure was porous and easily stretched.
I. The Big Picture: A Match That Fit the Season’s Script
The 4–2 scoreline in Omaha’s favour mirrored both clubs’ seasonal DNA. Omaha once again found ways to score in volume; they have failed to score in 0 matches in total this campaign, and their biggest home win before this was already a 4–2. The attack is not an accident; it is a repeatable pattern.
Fort Wayne, meanwhile, extended a brutal sequence. Their form line of LLL in the competition underlines a side that has yet to find a foothold. Overall they concede 3.3 goals per match in total, with no clean sheets at home or away. This fixture did nothing to disrupt that trend.
II. Tactical Voids and Discipline: Edges in the Margins
There were no listed absentees for either side, so both managers effectively had their full squads. That made the selection choices and in-game management even more revealing.
Marco Candela Lopez Vincenzo leaned into a front-loaded Union Omaha XI. C. Jensen, wearing 99, anchored the side, with an attacking ensemble of A. Gavilanes (77), D. Borczak (11), A. Gomez (21) and P. Botello Faz (9) giving the hosts multiple reference points between the lines and in behind. Behind them, the presence of Gabriel Cabral and S. Ors Navarro suggested a double-pivot capable of both building play and counter-pressing after turnovers.
Fort Wayne’s lineup carried similar attacking intent. The front band of J. Thomas (23), D. Oyetunde (9) and R. Becher (21), supported by J. Garay (8) and E. Nieto (18), indicated a desire to trade blows rather than sit deep. But the season’s disciplinary and defensive data hinted at how risky that approach might be.
Union Omaha’s card profile is sharp but controlled. Their yellow cards are spread with a clear late-game edge: 50.00% of their yellows come between 61–75 minutes, with another 25.00% in the 76–90 window. There is a single red card on their record, shown between 61–75 minutes (100.00% of their reds), suggesting that when intensity spikes after the hour, their aggression can tip over.
Fort Wayne, however, live permanently on that disciplinary cliff edge. Their yellow-card distribution shows a pronounced late-game surge: 44.44% of their yellows arrive between 76–90 minutes, with 22.22% in each of the 16–30 and 31–45 windows. This is a side that starts combative and ends frantic, often chasing matches and paying for it in cautions. In a high-tempo contest like this one, that lack of composure becomes a structural weakness.
III. Key Matchups: Hunter vs Shield, Engine Room vs Enforcer
With no official top-scorer data provided, the “Hunter vs Shield” lens becomes more collective than individual.
On one side, Union Omaha’s attack: overall they average 2.3 goals per match in total, rising to 2.5 at home. They have never failed to score this campaign, and their biggest home output is 4 goals. That is the profile of a side that will always back itself to find multiple routes to goal, especially with creators like Gavilanes and Gomez flanking a central threat in Botello Faz.
On the other side, Fort Wayne’s defensive “shield” has been repeatedly pierced. They concede 3.5 goals per match on their travels and 3.3 in total. Their heaviest away defeat, a 4–2, is not just an outlier; it is emblematic of a line that cannot absorb sustained pressure. Against an Omaha side that thrives on chaos, Fort Wayne’s back line—featuring J. Smith, R. Sproat, J. Solis and A. Hernandez—was always likely to be dragged into wide spaces and exposed to late-arriving runners.
In the “Engine Room” battle, Omaha’s central axis of Gabriel Cabral and S. Ors Navarro had the platform to dictate tempo. Omaha’s season-long pattern—no clean sheets but constant scoring—suggests a midfield comfortable with verticality: they accept open games and trust their attackers to outscore the opponent.
Fort Wayne’s response came through J. Garay and E. Nieto, tasked with both screening transitions and feeding the front line. But the team’s overall numbers—0 wins in total, 0 clean sheets, and a biggest away defeat of 4–2—underline that their midfield shield has not been robust enough. Once Omaha pulled them into a stretched contest, Fort Wayne’s engine room was more fire-fighting unit than orchestrator.
IV. Statistical Prognosis: What This Result Tells Us About the Road Ahead
Following this result, the patterns harden rather than shift. Omaha remain a high-variance, high-ceiling side: 2 wins, 1 loss, 7 goals scored and 8 conceded in total, a goal difference of -1 that disguises how dangerous they are going forward. Their penalty record (1 taken, 1 scored, 100.00% conversion, with 0 missed) adds another layer of ruthlessness in decisive moments.
Fort Wayne’s prognosis is starker. With 0 wins, 3 losses, 5 goals scored and 10 conceded in total (goal difference -5 in the stats snapshot, and -6 in the standings context), they are consistently on the wrong end of multi-goal matches. They have yet to fail to score in a match, which is encouraging, but conceding an average of 3.5 goals away and 3.0 at home is unsustainable.
If we map expected goals conceptually onto these trends, Omaha project as a side whose xG for will remain strong, particularly at Werner Park, while their xG against will stay inflated until they tighten their defensive structure. Fort Wayne’s defensive xG profile, based on volume of goals conceded and lack of clean sheets, would likely be among the worst in the group, demanding either a tactical recalibration or a shift towards more conservative game plans.
In tactical terms, this 4–2 felt inevitable: a free-scoring home side facing a leaky away defence. For Union Omaha, the challenge now is to evolve from exhilarating to efficient, turning shootouts into controlled wins. For Fort Wayne, survival in this competition will depend on whether they can turn their attacking flashes into something more than consolation goals in matches that are slipping away.
Related News

Indy Eleven Edges Lexington in USL League One Cup Showdown
Louisville City Edges Detroit City in Penalty Shootout
Lexington vs Indy Eleven: Key USL League One Cup Clash
Lexington vs Indy Eleven: USL League One Cup Group Stage Preview
Detroit City vs Louisville City Match Preview
Lexington vs Indy Eleven Predicted Lineups: Team News and Match Insights