
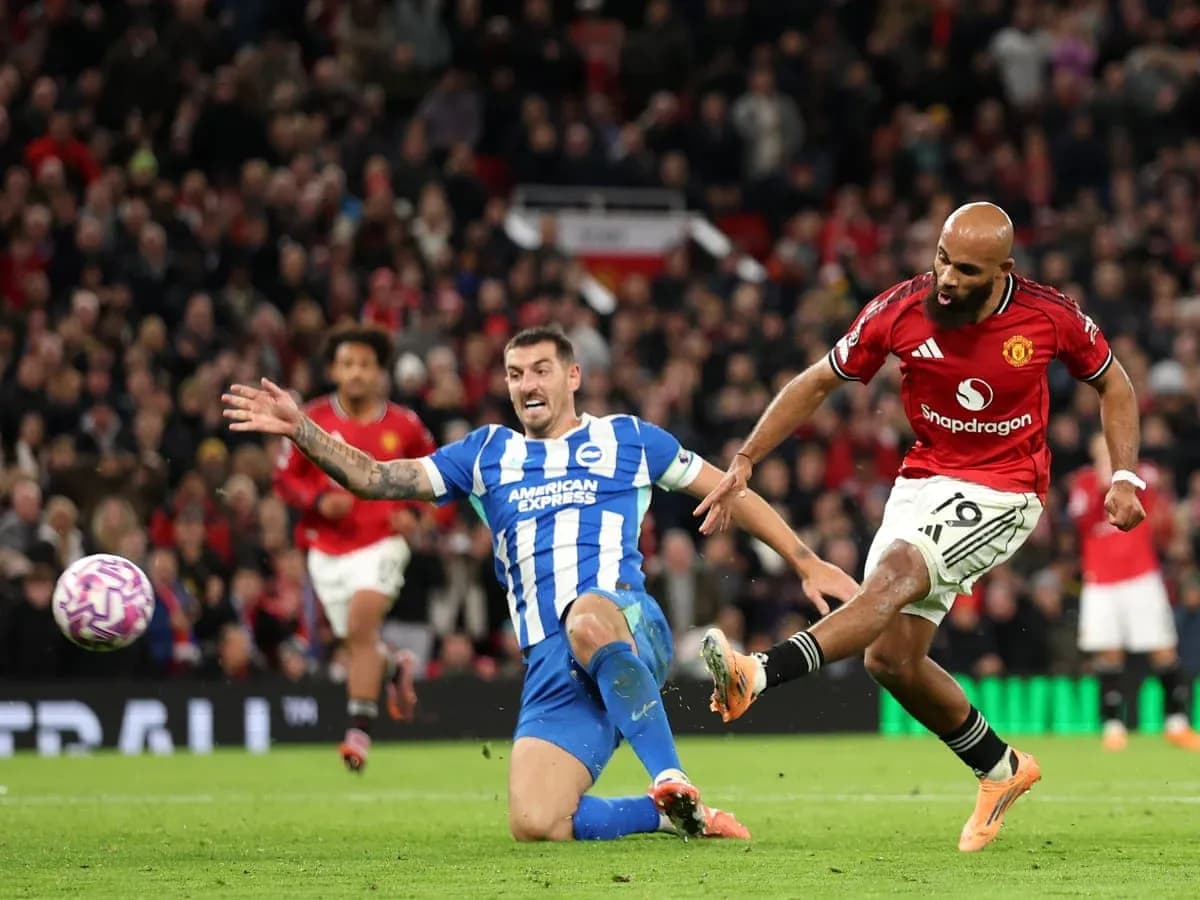
Brighton vs Manchester United: A Tactical Breakdown of the 3–0 Result
Under the grey May skies at the Amex Stadium, Brighton’s season-long balancing act between ambition and fragility met the ruthless efficiency of a Manchester United side that has learned to win in different ways. Following this result, the 3–0 scoreline did more than settle a final-day fixture; it crystallised the gap between a team on the fringes of Europe and one already moulded for the Champions League.
I. The Big Picture – Two 4-2-3-1s, two very different outcomes
Both coaches mirrored each other on the board: Fabian Hurzeler and Michael Carrick sent their sides out in a 4-2-3-1, but the systems carried contrasting identities.
Brighton, finishing 8th in the Premier League with 53 points and a goal difference of 6 (52 scored, 46 conceded), leaned into what has been their seasonal DNA: structured possession, late surges, and a strong home backbone. At home this campaign they played 19 league games, winning 9, drawing 6 and losing only 4, with 30 goals for and 20 against. Their home averages – 1.6 goals scored and 1.1 conceded – framed the Amex as a difficult place to dominate.
Manchester United arrived as a more complete, if sometimes chaotic, proposition. They closed the season 3rd with 71 points and a goal difference of 19 (69 scored, 50 conceded). On their travels they played 19 times, winning 7, drawing 8 and losing 4, with 30 goals for and 26 against – an away scoring average of 1.6 and 1.4 conceded, numbers that speak to a side happy to trade punches but confident they will land heavier blows.
The league-wide timing patterns told us this might be a slow-burning contest that would open up brutally late. Brighton’s goals this season surged in the 76–90 minute window, where 18 of their 52 goals came – a striking 32.73%. United, by contrast, were most dangerous both just before the interval (31–45, 20.59% of their league goals) and again late (76–90, 23.53%). The script was set for a game in which patience, and the control of transitions around half-time, would be decisive.
II. Tactical Voids – Absences that re-shaped the chessboard
Brighton entered without three significant pieces: K. Mitoma (hamstring injury), S. Tzimas and A. Webster (both knee injuries). Mitoma’s absence stripped Hurzeler of his most natural one-v-one outlet on the flank, forcing a more centralised creative burden on D. Gomez, J. Hinshelwood and M. De Cuyper behind D. Welbeck. Without Webster, L. Dunk had to marshal a back four that included M. Wieffer and F. Kadioglu – technically secure, but still bedding into Premier League-level defensive chemistry.
On the other side, United were missing Casemiro (inactive), B. Sesko (leg injury) and M. de Ligt (back injury). Casemiro’s omission was the most structurally significant. Carrick compensated by pairing K. Mainoo with M. Mount as the double pivot, trading some destructive edge for press resistance and vertical passing. Without de Ligt, Harry Maguire partnered L. Martinez, a pairing that leans on Martinez’s aggression and distribution to offset Maguire’s lack of mobility.
Disciplinary profiles added a hidden layer of tension. Dunk, one of the league’s leading collectors of yellow cards with 10, and Luke Shaw, on 9 yellows, both walked a familiar tightrope. Casemiro’s season-long 10 yellows and 1 yellow-red – though absent here – underlined how United’s midfield normally lives on the edge; in his absence, Mainoo’s calmer profile helped United control the tempo without inviting unnecessary card risk.
III. Key Matchups – Hunter vs Shield, Engine Room vs Enforcer
Hunter vs Shield tilted dramatically United’s way.
For Brighton, D. Welbeck carried the scoring mantle. In total this campaign he produced 13 league goals and 1 assist from 37 appearances, with 46 shots and 28 on target. He is a penalty-box forward who also grafts: 24 tackles, 9 interceptions, and 178 duels contested. But his penalty record undercut his reliability from the spot – he scored 1 but missed 2 penalties, a detail that matters in tight games where xG often spikes from dead balls.
His task was to crack a United defence that, in total, conceded 50 goals at an average of 1.3 per match, with away numbers only slightly worse at 1.4. United’s biggest away defeat was 3–0, but their best away wins (1–4) showed they rarely die wondering. With Martinez stepping out aggressively and Maguire defending the box, Welbeck was often asked to hold up play against numbers rather than find clean runs in behind.
At the other end, B. Mbeumo was United’s spearhead from the right, starting as the nominal striker here. In total he scored 11 league goals and added 3 assists, taking 59 shots with 32 on target. His game is built on volume duels (265 contested, 86 won) and repeated sprints into half-spaces. Against a Brighton back line led by Dunk – who blocked 27 shots and made 30 interceptions over the season – this became a battle of persistence versus positioning.
Behind Mbeumo, the “Engine Room” duel defined the rhythm. Bruno Fernandes, the league’s top assist provider with 21, orchestrated United’s attacks. Across the season he scored 9 goals, delivered 137 key passes from 1,994 total passes at 82% accuracy, and still found time for 54 tackles and 5 blocked shots. His penalty record was imperfect – 4 scored but 2 missed – another reminder that United’s xG from the spot did not always convert cleanly.
Opposite him, P. Gross and J. Milner formed Brighton’s double pivot. Both are intelligent, positionally disciplined players, but neither has the athletic range of Mainoo or the creative volume of Fernandes. Their task was twofold: screen the central lanes where Fernandes loves to receive between the lines, and launch the first pass into Welbeck or the advanced midfield trio. Under United’s coordinated press from Mount and Mainoo, that outlet was often smothered.
IV. Statistical Prognosis – Why 3–0 felt logical
Following this result, the numbers that framed the season help explain why a United win by multiple goals felt like a natural extension of the underlying trends.
United’s attack, in total, averaged 1.8 goals per game compared to Brighton’s 1.4. Defensively, the gap was narrower – Brighton conceded 1.2 per match overall, United 1.3 – but the timing patterns were crucial. United’s biggest concession window was 46–60 minutes, where 23.53% of their goals against arrived, while Brighton’s heaviest defensive leak came just before half-time (31–45, 25.58%) and again late (76–90, 20.93%).
Overlay that with United’s own offensive spikes – 20.59% of their goals between 31–45 and 23.53% between 76–90 – and you have a classic “crossed wires” scenario: United’s surges aligned almost perfectly with Brighton’s softest defensive phases. Once United established a first-half lead, Brighton’s late-game attacking surge (32.73% of their goals in the final quarter-hour) was always likely to open spaces for United to counter and inflate the scoreline.
Brighton’s season-long under/over profile underlined their difficulty in turning games chaotic on demand: only 5 of their 38 league matches went over 2.5 goals. United, despite their attacking power, also saw just 10 of 38 go over 2.5. The fact this game still reached three United goals suggests a performance that beat the median expectation, but remained consistent with the structural advantage of a side that finishes 3rd, carries multiple double-digit scorers, and has a playmaker in Fernandes capable of bending xG in his favour.
In narrative terms, the 3–0 at the Amex felt like the season’s final, honest verdict. Brighton’s organised, possession-heavy 4-2-3-1 could carry them to the edge of Europe, but without Mitoma’s chaos and with Welbeck’s penalty frailty, their margin for error was thin. United, even without Casemiro and de Ligt, had enough firepower, structure and late-game punch to turn a balanced tactical board into a lopsided scoreline.
Related News
Bournemouth vs Liverpool Prediction: Key Stats and Betting Tips
Tottenham vs Aston Villa Predicted Lineups: Team News for Premier League Clash
Brighton vs Arsenal: Premier League Clash Preview
Manchester City vs Sunderland: Premier League Clash Preview
Tottenham vs Aston Villa: Early Relegation Battle
Brentford vs Chelsea Predicted Lineups: Team News and Match Insights