

Tacoma Defiance Edges Ventura County 1–0: A Tactical Analysis
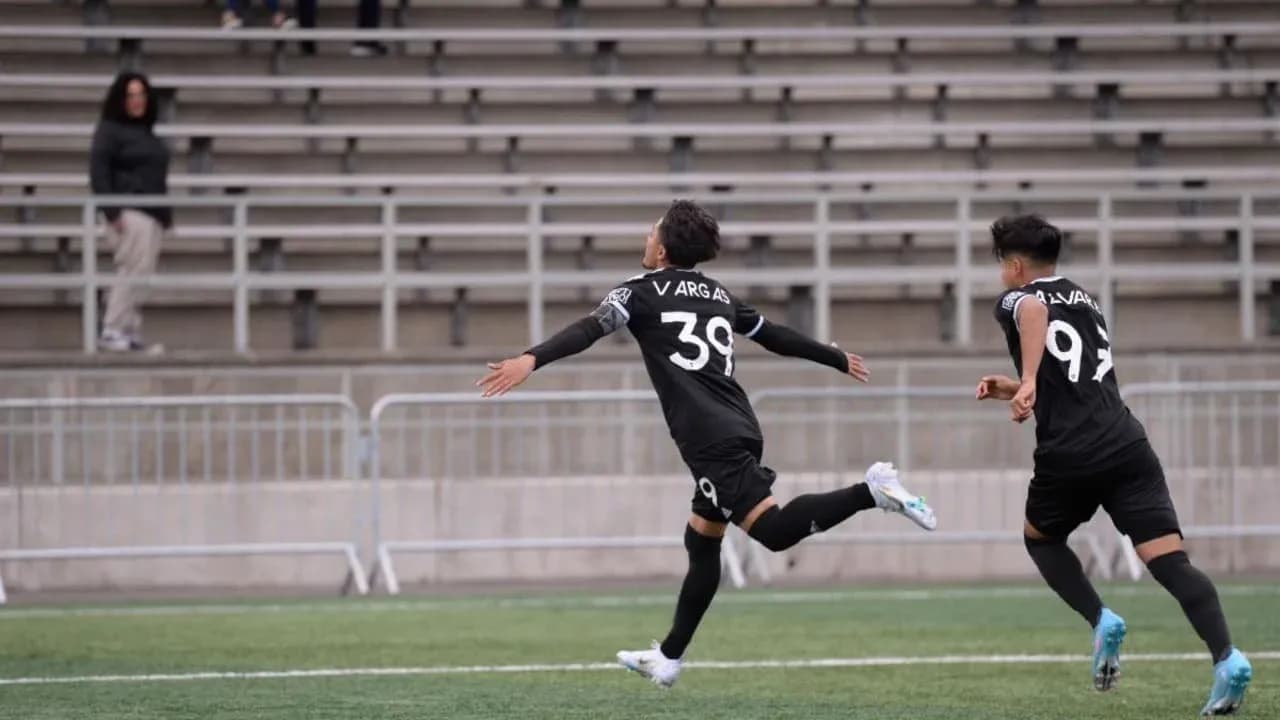
Under the lights at Starfire Sports, Tacoma Defiance edged Ventura County 1–0, a narrow scoreline that barely hints at the deeper tactical story. Following this result, it felt less like an upset and more like a recalibration of what Tacoma can be in MLS Next Pro’s Pacific Division: a flawed but dangerous side whose volatility cuts both ways.
I. The Big Picture – contrasting identities, converging on a knife‑edge
Across the season overall, Tacoma have been a paradox. Their form line of “LLWLLLLWWLWW” captures a team oscillating between collapse and conviction. In total this campaign they have played 12 league matches, winning 5 and losing 7 with no draws. The goal numbers underline the chaos: in total this campaign they have scored 15 and conceded 19, an overall average of 1.3 goals for and 1.6 against per match. The goal difference of -4 reflects a side that often has to outscore its own defensive instability.
At home, though, Tacoma are more nuanced. Across 7 home fixtures they have 3 wins and 4 defeats, with 9 goals for and 8 against. An average of 1.3 goals scored and 1.1 conceded at Starfire Sports suggests that when they do get their structure right, they can grind.
Ventura County arrived as the more stable force in the table. In total this campaign they sit on 19 points from 13 matches, with 7 wins and 6 losses, again with no draws. Their 24 goals for and 21 against give them an overall goal difference of +3, powered by a lively attack: 1.8 goals scored per match and 1.6 conceded. On their travels, Ventura have been particularly assertive: 5 wins and 3 defeats across 8 away games, with 14 goals scored and 11 conceded, an away average of 1.8 goals for and 1.4 against.
On paper, then, this was the league’s fourth‑ranked Pacific side, with promotion play-off aspirations in the Eastern Conference context, visiting a Tacoma team sitting sixth in the Pacific, 11th in the broader conference snapshot, and still trying to tame its own volatility. The 1–0 full‑time score in Tacoma’s favour is a small but significant rebalancing of that narrative.
II. Tactical voids and disciplinary undercurrents
With no official injury or suspension list, both coaches had near‑full squads, but the absences that mattered were structural rather than individual. Tacoma’s season data shows a team prone to emotional spikes: in total this campaign they have collected the bulk of their yellow cards between 31–60 minutes, with 25.00% of bookings in the 31–45 range and 31.25% in the 46–60 window. That mid‑match turbulence often disrupts rhythm and forces tactical conservatism.
Ventura, by contrast, are late‑game agitators. In total this campaign 27.78% of their yellows come between 46–60 minutes, but the real surge arrives after the hour: 33.33% in the 61–75 range and another 33.33% between 76–90. They tilt matches into chaos just when legs are heavy and concentration wanes.
In this fixture, Tacoma’s ability to stay on the right side of that emotional line was as important as any tactical tweak. Their season record shows no red cards at all, and that discipline under pressure – particularly in a match where they were defending a one‑goal lead for long stretches – was decisive against a Ventura side that habitually turns the final quarter‑hour into a running battle.
III. Key matchups – Hunter vs Shield, and the engine room duel
Without official top‑scorer or assist charts, the “Hunter vs Shield” duel becomes a clash of attacking profiles rather than individuals. Ventura’s attack, scoring 1.8 goals per match overall and the same 1.8 on their travels, is built to stretch games. Their biggest away win of 0–2 and capacity to score up to 4 on their travels underlines a front line that thrives in open spaces.
That met Tacoma’s defensive record at home: 8 goals conceded in 7 matches, an average of 1.1 per game at Starfire Sports. For a team that concedes 1.6 per match overall, home is where Tacoma compress space and manage risk. The 1–0 scoreline is exactly what their home metrics hint at: when they get their distances right, they can drag even a free‑scoring side like Ventura down into a low‑margin contest.
On the ball, Tacoma’s “engine room” was defined by their central trio of X. Gnaulati, M. O’Neill and C. Phoenix. Gnaulati, wearing 32, often looked like the connective tissue between back line and attack, while O’Neill (40) and Phoenix (48) balanced progression with protection. Their task was to disrupt Ventura’s core of Pepe, G. Arnold and I. Luna, who typically form the away side’s creative axis.
The duel turned on control of second balls and rest defence. Tacoma’s season profile shows they have failed to score in 4 matches overall, but at home they have still found 9 goals, and they have already produced a 4–1 home win at their best. That ceiling was never reached here; instead, the midfield three focused on denying Ventura the transition platforms that usually feed their 1.8 away goals per game.
Behind them, the back line of R. Sailor and G. Sandnes, flanked by D. Alvarez and C. Phoenix when he dropped deeper, had to cope with Ventura’s movement. Given Ventura have only failed to score once in total this campaign, shutting them out is a statement. Tacoma’s season total of 3 clean sheets – 2 at home and 1 away – now has a fourth chapter, and this one carries more weight than the numbers alone.
Up front, the fluid trio of C. Gaffney, R. Jauregui and E. Carli worked more as disruptors than pure finishers, dragging Ventura’s defensive unit of M. Vanney, S. Hernandez, E. Martinez and R. Dalgado into uncomfortable channels. Tacoma’s penalty record – 1 taken, 1 scored, 100.00% conversion – never came into play, but their willingness to attack the box kept Ventura honest.
IV. Statistical prognosis – a defensive correction, not a fluke
Following this result, the analytics tilt slightly in Tacoma’s favour without rewriting the season’s script. In total this campaign, they remain a team that concedes more than they score (15 for, 19 against), but this clean sheet against a side averaging 1.8 goals per match overall and on their travels suggests a defensive correction rather than a one‑off.
Ventura’s overall goal difference of +3 is built on sustained attacking output, and their away record of 5 wins from 8 still marks them as one of the division’s more dangerous travellers. Yet this match exposed the fragility behind the numbers: 21 goals conceded in total, 11 of them away, means their attacking edge always carries defensive risk. When they do not convert their chances, they are vulnerable to exactly this kind of narrow defeat.
In Expected Goals terms – even without raw xG values – the pattern is clear. Tacoma’s home averages (1.3 for, 1.1 against) and Ventura’s away profile (1.8 for, 1.4 against) point to a game that “should” live in the 1–1 or 2–1 band. A 1–0 home win sits at the conservative edge of that range but remains statistically plausible, especially when the home side protects a lead with the discipline Tacoma showed.
The broader prognosis is nuanced. For Tacoma, this is a template: compressive, disciplined, leaning on a midfield that can both spoil and spring. If they can replicate this Starfire identity, their -4 overall goal difference can start to narrow, and their position in both the Pacific Division and Eastern Conference snapshots could climb.
For Ventura County, the lesson is harsher. Their promotion‑chasing profile remains intact, but this defeat underlines that raw attacking volume is not enough. Against organised home sides like Tacoma, they will need a more controlled engine room and a defensive structure that can withstand long spells without scoring. Otherwise, their 1.8 goals per match and positive goal difference risk becoming flattering numbers in a season defined by tight, unforgiving margins.
Related News

MLS Winners and Losers: Rising USMNT Star Cavan Sullivan, St. Louis City's Smart Moves, and Chicago Fire's Struggles Without Hugo Cuypers

MLS Highlights: Portland Timbers End Drought, Josh Sargent Shines, Cavan Sullivan Impresses
Tacoma Defiance vs Colorado Rapids II Stats: Head-to-Head Record

St. Louis City II vs Vancouver Whitecaps II: Head-to-Head Stats and Match Preview

Atlanta United II vs New York City II Stats: Head-to-Head Record

Houston Dynamo FC II vs Austin II Stats: Head-to-head Record