
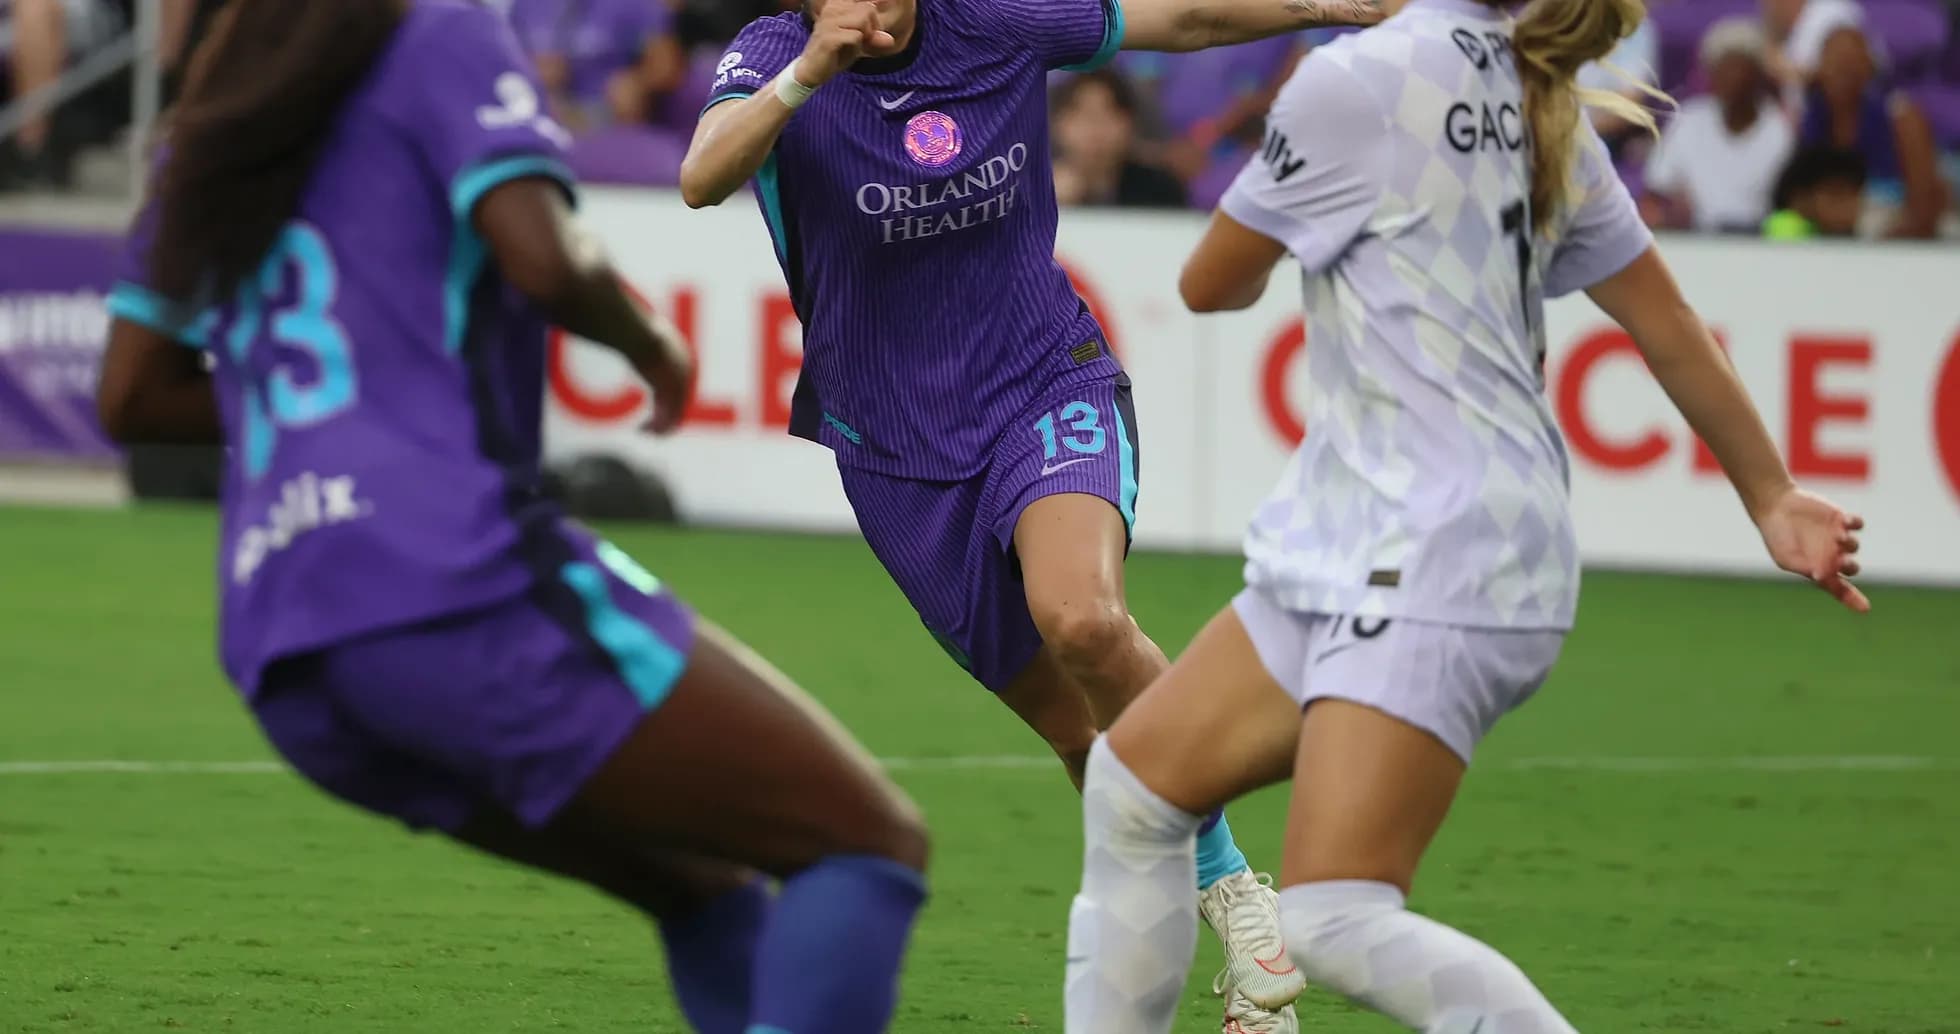
Portland Thorns W Dominate Orlando Pride W in NWSL Showdown
Under the lights of Exploria Stadium, this Group Stage meeting in the NWSL Women felt like a referendum on two very different footballing identities. Orlando Pride W, 11th in the table with 30 points and a goal difference of -8 (32 scored, 40 conceded in total), came in as a volatile, punchy side: capable of three‑goal wins, just as capable of being blown away. Portland Thorns W arrived with the poise of a playoff contender, 5th with 42 points and a positive goal difference of 8 (42 for, 34 against overall), their season defined by attacking variety and a more stable floor.
The 4-1 scoreline to Portland in regular time underlined the gap. Yet tactically, this was a story of two teams who both chose the same shape on paper — 4‑2‑3‑1 — and then used it in radically different ways.
I. The Big Picture – Mirrored Shapes, Different Temperaments
Orlando’s 4‑2‑3‑1 under S. Hines was front‑foot in intention. C. Morché started in goal, shielded by a back four of Oihane Hernández, C. Dyke, H. Anderson and H. Mace. The double pivot of A. Lemos and Luana was supposed to provide the platform for a fluid three of H. McCutcheon, S. Yates and S. Washington behind lone striker B. Banda.
Heading into this game, Orlando’s home numbers told a clear tale: 20 goals scored and 20 conceded at home, an average of 1.5 goals both for and against per match at Exploria. They were never far from chaos, and their biggest home defeat of the season — a 1‑4 scoreline — foreshadowed exactly what would unfold again here.
Portland, under Robert Vilahamn (Karlsson), also lined up in a 4‑2‑3‑1, but with a more layered structure. M. Arnold in goal, a back four of R. Reyes, Carolyn Lisette Calzada, J. Perry and M. Müller, double pivot N. Nijstad and J. Fleming, then a dynamic band of three — R. Turner, P. Tordin, Caiya Hanks — behind S. Smith.
The Thorns came in with a strong attacking profile: in total this campaign, they had scored 42 goals, split evenly between 21 at home and 21 on their travels, with away scoring at 1.6 goals per match. The defensive split was more revealing: only 8 conceded at home, but 26 away, an away average of 2.0 goals conceded. Portland score away; they also give you chances. Orlando, however, never really managed to exploit that fragility.
II. Tactical Voids – Risk, Discipline and the Edges of Control
For Orlando, the first tactical void lay in their own risk profile. Over the season they had kept 3 clean sheets at home and failed to score only once there, but their overall concessions — 40 in total — were a structural issue, not bad luck. The high defensive line, with full-backs Hernández and Mace asked to push on, left Dyke and Anderson repeatedly exposed to the pace and movement of Smith and the inside drifting of Hanks and Tordin.
Disciplinary trends added another layer of tension. Orlando’s yellow-card distribution this season peaks in the final half-hour: 24.14% of their yellows between 61‑75 minutes and another 24.14% between 76‑90. They also have a single red card in the 61‑75 window. That late-game volatility, combined with a high defensive line against one of the league’s most dangerous transition attacks, was always a combustible mix.
Portland, by contrast, spread their yellows more evenly, but still show a late surge: 20.00% of yellows from 61‑75 and 23.33% from 76‑90, with red cards scattered across early and mid-game phases. In a match that Orlando were always likely to chase, Portland’s comfort in managing high-tempo, card-heavy phases became a quiet advantage: they could foul, break rhythm, and still keep their structure.
III. Key Matchups – Hunter vs Shield, Engine Room Battles
The headline duel was always going to be B. Banda versus Portland’s back line. Banda entered as one of the league’s elite forwards: 15 goals and 2 assists in 21 appearances, with 66 shots and 36 on target, and a rating of 7.65. She is a volume shooter and a duel magnet, engaging in 173 duels and winning 72, drawing 34 fouls. Orlando’s entire attacking plan leaned on her ability to stretch and destabilise.
Yet the “shield” she ran into was more collective than individual. J. Perry, one of the league’s top carded defenders with 6 yellows and 1 red, is aggressive by design — 15 tackles, 5 blocked shots, 12 interceptions, and 564 passes at 82% accuracy. Alongside Carolyn Lisette Calzada and with Reyes and Müller pinching in, Portland could compress the central lanes and accept the risk of fouls to keep Banda facing away from goal. They were helped by Orlando’s limited secondary threat: beyond Banda, the Pride’s season-long attacking contributions have been far thinner.
At the other end, S. Smith and P. Tordin formed a devastating “hunter” duo. Smith, with 11 goals and 3 assists, and Tordin, with 6 goals and 7 assists, give Portland dual scoring and creative outlets. Tordin’s 41 key passes and 427 total passes at 72% accuracy mark her as the true connector, while Smith’s 75 shots (44 on target) and 64 dribbles attempted make her the spearhead.
The engine-room clash was equally decisive. Orlando’s McCutcheon, one of the league’s leading yellow-card recipients with 5 yellows, is a high-contact midfielder: 50 tackles, 10 blocked shots, 28 interceptions, 174 duels with 88 won. She and Luana were tasked with disrupting Fleming and Nijstad, but Portland’s double pivot had both the technical quality and positional discipline to play around pressure. Fleming’s calm passing and Nijstad’s screening allowed Tordin to receive between the lines, dragging Orlando’s pivots out of shape and creating channels for Smith’s runs.
IV. Statistical Prognosis – Why 4-1 Felt Inevitable
Even without explicit xG data, the season numbers point towards Portland’s superiority in chance creation and conversion. In total this campaign, they average 1.7 goals scored per match, compared to Orlando’s 1.3. Defensively, Portland concede 1.4 per match overall, while Orlando allow 1.6. Layer in the standings context — 12 wins for Portland versus 9 for Orlando, and a clear gap in goal difference — and a multi-goal away win sits comfortably within expectation.
Penalty dynamics underline a further edge. Orlando have earned 4 penalties in total, scoring 2 and missing 2, a 50.00% conversion rate that hints at fragility in high-leverage moments. Portland, by contrast, are perfect from the spot: 6 penalties taken, 6 scored, 100.00% conversion. In a league where fine margins often decide tight games, that ruthlessness matters.
Following this result, the tactical narrative is stark. Orlando’s 4‑2‑3‑1 remains an attacking platform, but without a more secure defensive structure and better late-game discipline, it exposes them to exactly the kind of punishment Portland delivered. The Thorns, meanwhile, showed why they sit in the playoff picture: a mirrored shape, but with superior spacing, more reliable decision-making in transition, and match‑winners in Smith and Tordin who tilt the expected goals ledger in their favour almost every week.
On a night when both sides revealed their seasonal DNA, Portland’s identity — layered, incisive, and coldly efficient — simply scaled better.
Related News
Racing Louisville W vs San Diego Wave W Prediction: Key Stats and Betting Tips
Bay FC W vs Orlando Pride W: Head-to-Head Stats Before September 2026 Match
Washington Spirit Dominates Chicago Red Stars in NWSL Clash
Portland Thorns W vs Houston Dash W Stats: Head-to-Head Record
Kansas City W vs Denver Summit W Stats: Head-to-Head Record
San Diego Wave Dominates Kansas City W with 2-0 Victory