
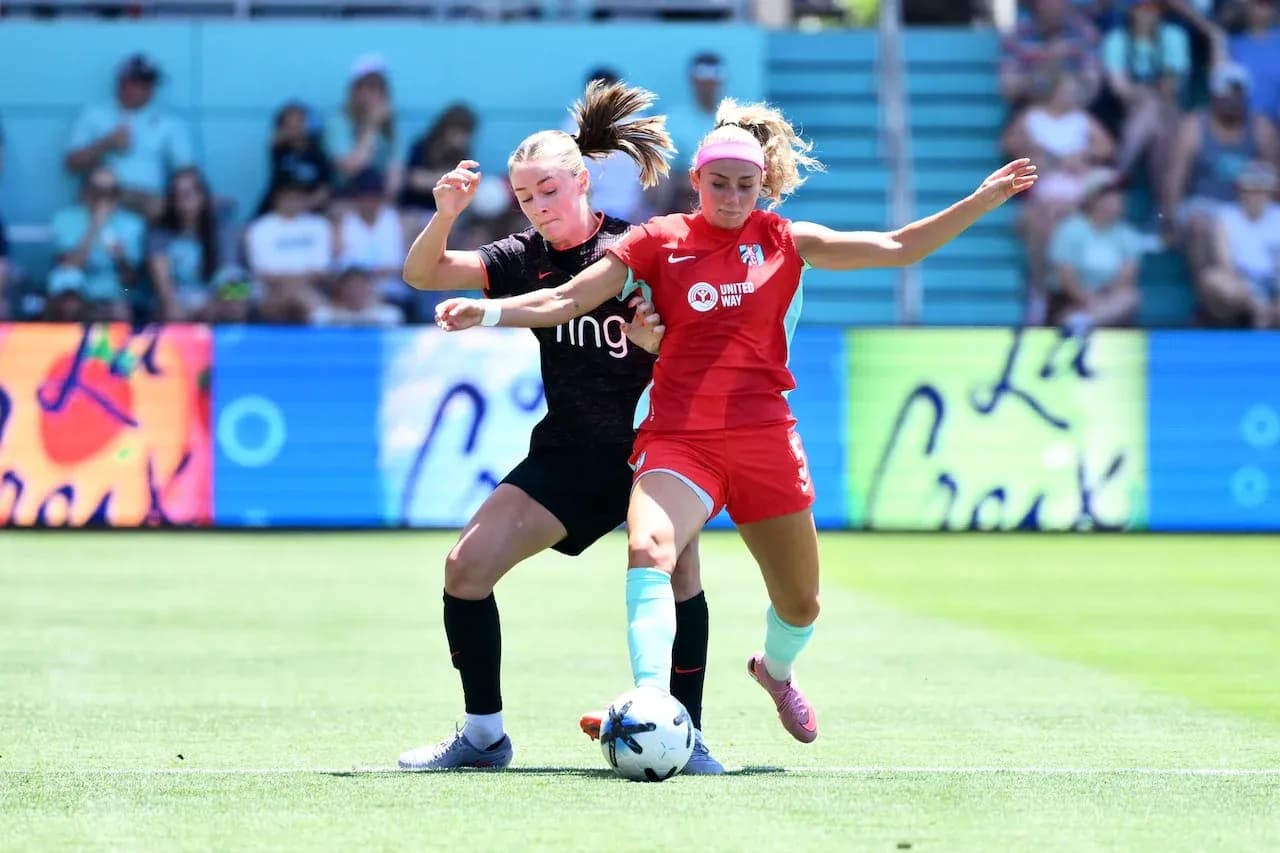
Kansas City Dominates Portland Thorns in NWSL Match
The lights at CPKC Stadium dimmed on the scoreboard but not on the statement Kansas City W made. Following this result, a 3–1 home win over Portland Thorns W in the NWSL Women group stage, the table tells a different story about both sides. Kansas City sit 6th with 18 points from 11 matches, their overall goal difference now perfectly balanced at 0 after scoring 17 and conceding 17. Portland, still 2nd on 23 points from 12, carry a more flattering overall goal difference of 6, built on 18 goals for and 12 against. Yet for all Portland’s status, it was Kansas City who dictated the tactical narrative.
I. The Big Picture – Home fortress vs contender’s flaw
This was a meeting of two teams with sharply contrasting home and away identities. Heading into this game, Kansas City at home had been flawless: 5 wins from 5, 13 goals scored and only 3 conceded, an average of 2.6 goals for and just 0.6 against at CPKC Stadium. On their travels, Portland had been solid but vulnerable: 3 wins, 1 draw and 3 defeats, with 10 goals scored and 12 conceded away, an average of 1.4 goals for and 1.7 against.
Both coaches leaned into the familiar: Chris Armas and Robert Vilahamn each set their side up in a 4‑2‑3‑1, mirroring shapes but not intentions. For Kansas City, the system is now their seasonal spine, used 8 times; for Portland, it has been their default in 9 matches. The symmetry on the board only heightened the contrast in execution.
Kansas City’s season-long attacking DNA is front‑foot and time‑specific. Overall they average 1.5 goals per match, but the real story lies in their timing: 31.25% of their goals come between 46‑60 minutes, a pronounced early‑second‑half surge, with another 18.75% in each of the 16‑30 and 31‑45 windows. Portland, by contrast, are explosive at the bookends: 27.78% of their goals arrive in the opening 15 minutes, and 22.22% in the 76‑90 window. This match was always going to hinge on whose rhythm imposed itself.
II. Tactical Voids and Discipline – Edges in the margins
There were no listed injuries or suspensions, so both coaches had near‑full decks. That made selection choices more revealing than enforced.
Armas trusted his established axis: Lorena in goal behind a back four of E. Bravo‑Young, G. Robinson, K. Sharples and I. Rodriguez; a double pivot anchored by L. LaBonta and B. Feist; and an attacking band of M. Cooper, C. Bethune and the league’s most devastating runner, T. Chawinga, supporting A. Sentnor.
Vilahamn answered with his own blend of steel and craft: M. Arnold in goal; a back line of R. Reyes, C. Calzada, S. Hiatt and M. Vignola; C. Bogere and J. Fleming as the double pivot; and an advanced trio of M. Muller, P. Tordin and R. Turner behind S. Wilson.
Discipline has quietly shaped Portland’s season. Their card profile shows a side that lives on the edge: yellow cards spread across all phases, with 27.27% arriving between 76‑90 minutes, and crucially, two red cards already this campaign. R. Reyes has been sent off once, and C. Bogere has accumulated a yellow plus a second yellow‑red combination. Kansas City, by contrast, have no red cards recorded and a more concentrated yellow distribution, with 37.50% of their bookings coming between 31‑45 minutes. That late‑first‑half spike speaks to a team willing to foul to protect momentum but rarely losing their heads.
In a match where both sides wanted to press and counter, that difference in disciplinary stability mattered. Kansas City could afford to be aggressive in midfield without fearing the kind of collapse a dismissal brings; Portland had to constantly manage the line, especially for Reyes and Bogere.
III. Key Matchups – Hunter vs Shield, Engine vs Enforcer
The headline duel was always going to revolve around T. Chawinga. Heading into this game, she had 6 goals and 2 assists in 7 appearances, from just 10 shots and 6 on target, with a 7.44 average rating. Her blend of direct dribbling (13 attempts, 7 successful) and penalty‑box efficiency has made her the league’s most ruthless finisher per chance.
Against her stood a Portland defensive unit that is split in personality. At home they had not conceded a single goal in 5 matches. Away, they had already allowed 12 in 7, averaging 1.7 against per trip. The late‑game numbers are damning: 41.67% of their goals conceded arrive between 76‑90 minutes, a clear vulnerability when legs are heavy and concentration wanes.
Kansas City’s own scoring curve peaks just after half‑time, but their ability to sustain pressure into the final quarter meant Chawinga and Sentnor were perfectly placed to exploit that late‑game Portland drop. When Portland’s away shield is at its weakest, Kansas City’s hunters are still at full sprint.
Engine Room – Playmakers vs Enforcers
The midfield confrontation was more intricate. For Kansas City, M. Cooper and C. Bethune are the creative pistons. Cooper entered with 2 goals and 3 assists, 10 key passes and 24 dribble attempts, while Bethune brought 2 goals, 3 assists, 12 key passes and 21 successful dribbles from 41 attempts. Together they form a dual‑threat engine that can both carry the ball and thread it.
Opposite them, Portland deployed a more combative axis. C. Bogere, with 33 tackles and 11 interceptions, is the archetypal enforcer, willing to commit fouls (17 so far) to break rhythm. J. Fleming offers a more balanced profile but still sits deeper than a pure creator. Higher up, R. Turner and P. Tordin add a different kind of danger: Turner’s 4 goals, 15 fouls drawn and 10 successful dribbles from 20 attempts make her a constant transitional outlet, while Tordin’s 3 goals, 4 assists and 20 key passes show a wide playmaker who can both finish and supply.
This match turned on which engine could impose its tempo. Kansas City’s plan was clear: use LaBonta and Feist to screen and recycle, then free Cooper and Bethune between the lines, forcing Bogere into constant lateral shuttling and duels. Every time Bogere stepped out to confront Bethune or Cooper, Chawinga and Sentnor could dart into the half‑spaces behind.
IV. Statistical Prognosis – Why the 3–1 made sense
Strip away the emotion and the numbers justify Kansas City’s control. Heading into this game, both sides averaged 1.5 goals per match overall, but Kansas City at home were a different beast: 13 goals in 5, while conceding only 3. Portland’s away attack, at 1.4 goals per match, met a back line that, at home, allowed just 0.6.
Time‑window data completes the picture. Kansas City’s 31.25% goal surge between 46‑60 minutes intersects brutally with a Portland defence that has no recorded goals conceded in that exact band but then collapses late, with 41.67% of their concessions in the 76‑90 stretch. Kansas City, meanwhile, concede only 5.56% of their goals in that same late window. In xG terms, this profile points to a match in which Kansas City were always more likely to sustain pressure and convert dominance into multiple goals, particularly as fatigue set in for Portland.
Portland’s own attacking peaks—27.78% of goals in the opening 15 minutes and 22.22% in the final quarter—demanded a fast start and a late surge. Kansas City’s defensive distribution, with 44.44% of goals conceded in the first 30 minutes, did leave that door ajar. The first‑half parity at 1–1 reflected that early Thorns threat. But once the interval passed, the probabilities swung heavily toward the home side’s structured aggression.
Following this result, the narrative around both squads sharpens. Kansas City are no longer just quietly efficient; they are a home juggernaut whose 4‑2‑3‑1, powered by Chawinga’s ruthless cutting edge and the dual creativity of Cooper and Bethune, can unpick even elite opposition. Portland remain a top‑tier side with high‑end talent in Turner and Tordin, but their away defensive fragility and disciplinary tightrope—embodied by Reyes and Bogere—are now clear fault lines.
On this night in Kansas City, the numbers, the tactics and the storyline converged: the hunter found the shield’s weak seam, and over 90 minutes, the 3–1 scoreline felt less like an upset and more like an inevitability written in the data.
Related News
Orlando Pride W vs Portland Thorns W: Playoff Showdown
San Diego Wave W vs Kansas City W Predicted Lineups: Team News for NWSL Women
Orlando Pride W vs Portland Thorns W Prediction: Key Stats and Betting Tips
San Diego Wave W vs Kansas City W: Key NWSL Clash Preview
San Diego Wave W vs Kansas City W Prediction: Key Stats and Betting Tips
Portland Thorns and Chicago Red Stars Draw in NWSL Showdown